Notre Dame Stays No. 1 In All-Time Winning Percentage

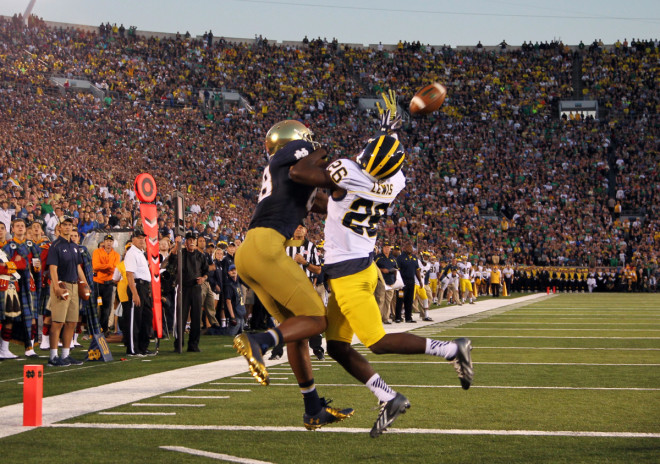
With identical 10-3 records in 2015, Notre Dame and Michigan remained 1-2 on the Football Bowl Subdivision’s all-time winning percentage chart, based on our updated calculations from all-time records compiled by the NCAA office.
Both the Fighting Irish and Wolverines have overcome some down periods since the turn of the century. They are positioned under their current leadership — and with consistent recruiting success and development — to continue to thrive. Notre Dame head coach Brian Kelly’s troops generally have been rated in the Nos. 8-12 spot this summer by about a half dozen outlets, but it’s been second-year head coach Jim Harbaugh who has created a buzz in Ann Arbor.
After transforming downtrodden Stanford into a power and leading the moribund San Francisco 49ers to a Super Bowl appearance, Harbaugh’s impact is already being felt with consensus preseason top-5 rankings this summer. Michigan has become a chic selection, not just dark horse, to make the four-team College Football Playoff.
The rise of both has prompted some speculation that the Notre Dame-Michigan football rivalry — ended in 2014 and not projected to be possibly renewed for at least a decade — might have a small window of opportunity for a 2018-19 series. First-year Michigan athletics director and former Wolverines football player Warde Manuel told the Detroit Free Press this May that he is “open” to a series with Notre Dame, but the scheduling logistics and commitments for both schools make it less likely.
Notre Dame replaced Michigan with Texas in 2015-16, and has future games with Georgia, Ohio State and Texas A&M, among others, in place of the Wolverines. Meanwhile, Michigan has included Arkansas, Virginia Tech, Washington, UCLA, Texas and Oklahoma on its docket, making another “brand” name less feasible.
“The Big Ten is a pretty tough conference and so knowing that we have nine games against Big Ten opponents, you look at the nonconference scheduling very closely to figure out that balance of those three games,” Manuel told the Detroit Free Press. “It’s important, it’s something I’m looking at, but nothing imminent in terms of changes.”
Notre Dame and Michigan are joined by Boise State and Ohio State as the lone schools eclipsing the .720 winning percentage mark. The Broncos, who have played only 47 years, were 81-12 from 2008-14 for a .871 figure, but took a bit of a dip with a 9-4 ledger in 2015.
Meanwhile, over the last 10 years Ohio State is 122-22 (.847) and shows no signs of slowing down under fifth-year head coach Urban Meyer, who is 50-4 (.926) with the Buckeyes.
Alabama, which has captured four of the last seven national titles, including 2015, continues to ascend at a rapid pace with a 98-12 record (.891) record under head coach Nick Saban since 2008.
Here are the Division I Football Bowl Subdivision all-time won-lost records by percentage:
School Games Pct. W L T
1. Notre Dame 1,247 games — .73215 (892-313-42)
2. Michigan 1,292 games — .72987 (925-331-36)
3. Boise State 578 games — .72318 (417-159-2)
4. Ohio State@ 1,248 games — .72235 (875-320-53)
5. Oklahoma 1,233 games — .71978 (861-319-53)
6. Alabama# 1,233 games — .71816 (864-326-43)
7. Texas 1,272 games — .70951 (886-353-33)
8. USC# 1,201 games — .69941 (813-334-54)
9. Nebraska 1,289 games — .69860 (880-368-41)
10. Penn State# 1,277 games — .68480 (854-382-41)
# Indicates record adjusted by action of the NCAA Committee on Infractions.
@ Indicates record adjusted by action of institution.
Here is how the percentage is calculated with the ties: Take the number of victories by a school, add to it half of the tie total (meaning it’s a half win and a half loss), and divide it by the number of games played. So for Notre Dame it’s 892 wins plus 21 (half of the 42 ties) that equals 913, and then divide it by the 1,247 games it has played in its history.
Michigan could pass Notre Dame in 2016 if there is about a three-game difference in won-lost records. For example, if the Wolverines finished 12-1 and the Irish 9-4, Michigan’s all-time percentage would be .73180 compared to Notre Dame’s .73174.